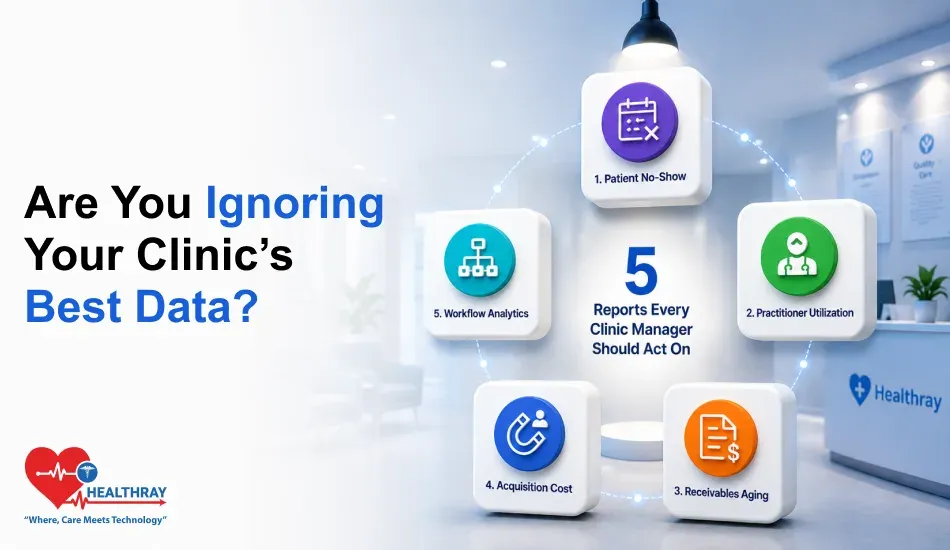
In This Blog
Everything required to conduct a data-driven audit of your practice through five operational reports:
- Which no-show measure will help you identify lost revenue, and how to fix it
- Understanding practitioner hours allocation, before inefficiency reduces efficiency
- Which AR aging categories will alert you early about potential cash flow issues
- Why CAC over LTV is the only marketing measure that really matters
- Understanding how much room velocity and machine downtime cost you
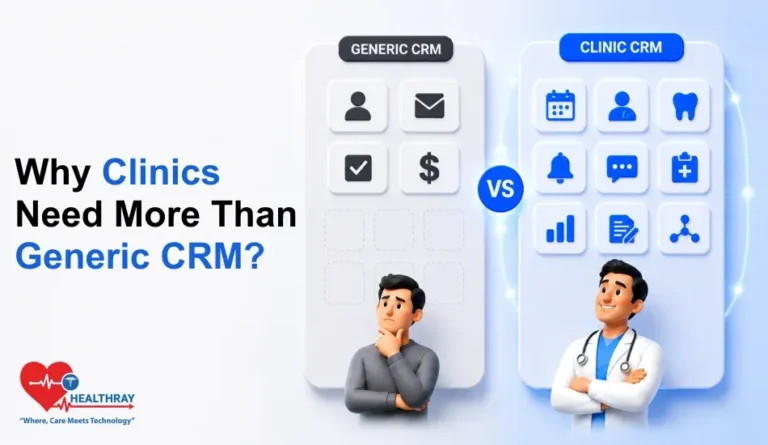
A clinic manager once told us her schedule looked fully booked every day. She still ended the quarter short. The appointments were there. The revenue was not. This is where healthcare analytics software helps. It reveals the gap between activity and revenue, especially when paired with revenue cycle analytics. That is a clinic software analytics problem, not a scheduling issue. We call this the Clinic Revenue Signal Audit or CRSA. It is five reports. Each one connects a data point in your system to a real decision.
Report 1: Audit Your Patient No-Show Rate Report For Revenue Optimization
The Metric Your Report Should Surface: Your total no-show percentage. But the real value comes from the breakdown by physician, by time slot, and by treatment type. Your clinic management software should track this in real time.
No-shows cost the U.S. healthcare system $150 billion every year. For an independent clinic, that means $150,000 in lost revenue annually. Three missed appointments in one eight-hour shift cut provider efficiency by 12.5%. Most clinic managers miss the real problem, though. A raw no-show percentage tells you almost nothing. Instead, you need to break it down by practitioner, time slot, and appointment type.
Research published by the National Library of Medicine tracked no-show rates across 10 clinics. The average came out to 18.8%. Subspecialty settings recorded the highest rates. So no-show patterns are specialty-specific, not clinic-wide. Filter first. Then decide. Once your report shows this detail, the path is clear. Use SMS reminders for high-risk slots. Set deposit rules for appointment types that keep getting abandoned.
The Operational Decision: Send SMS reminders during your highest-risk booking windows. Or require deposits for the appointment types that get abandoned the most.
 PRO TIP
This is how you protect your revenue. But after you stop losing money on no shows, the next question is easy – Are those who do show up getting proper service? This is covered in Report 2.
Report 2: Audit Your Practitioner Hours Allocation Report For Staff Efficiency
The Metric Your Report Should Surface: Specifically, each practitioner’s consultation hours versus total hours worked. This single ratio reveals how much billable time you’re quietly losing.
In fact, your practitioners are your greatest expense. For example, a clinician working eight hours with only three patient hours wastes five hours. Consequently, that waste comes from admin issues, scheduling gaps, or room problems. Ultimately, it costs money every day.
What The Utilization Ratio Tells You
This is not a motivation issue. Rather, it is a data issue. Your clinic software analytics must show the ratio of hours worked against hours scheduled per practitioner. When that drops below 65%, the problem is not your staff. It is your schedule. That is an easier fix. The table below shows how the same eight hours can mean very different results.
| SHIFT TYPE | SCHEDULED HOURS | CONSULTATION HOURS | UTILIZATION RATE |
| Optimized | 8 hrs | 5.6 hrs | 70% |
| Average | 8 hrs | 4.2 hrs | 52% |
| Low | 8 hrs | 2.8 hrs | 35% |
Decisions This Report Should Drive
First, match shift schedules to peak patient demand. Next, use your clinic appointment booking software to fix room blocks and cut idle time. Finally, reduce hours in low-demand periods instead of scheduling staff you cannot fill.
The Operational Decision: Shift staffing to match your busiest hours. Fix room blocks that create dead time. Or cut hours during slow periods.
 NOTE
NOTE
Being aware of how your staff time is being spent guards your capacity. But your capacity won’t make money for you unless you capture it. This is the purpose of Report 3.
Report 3: Audit Your Accounts Receivable Aging Report For Cash Collections
The Metric Your Report Should Surface: A breakdown of all the aged accounts receivable as a percentage of the number of days past due for each 30-day, 60-day, and over-90-day period.
The aging AR report is a core function of revenue cycle management software. Think of it as the clinic’s financial pulse rate. It shows how fast you recover funds owed to you. Finance managers using medical billing software watch claims aged 30, 60, 90, and over 120 days closely. The longer a debt sits, the harder it is to recover. The healthcare sector lost $17.4 billion to bad debt over 120 days old. That’s the scale of the problem.
For accounts past 60 days, stop sending statements and collect payments at checkout using card-on-file billing. Ensure strong cloud clinic software security to protect patient payment data and maintain compliance.
The Operational Decision: Train staff to collect balances at checkout. Or switch to automated card-on-file billing and skip the follow-up calls entirely.
Better collections mean protecting the revenue that you have already earned. However, future growth will require getting the right people through your doors. This is where Report 4 comes in.
Report 4: Audit Your Patient Acquisition Cost Report For Marketing Returns
The Metric Your Report Should Surface: Customer acquisition cost versus patient lifetime value, tracked by channel. This shows exactly where your profitable patients come from.
Clinic marketing is mostly done out of habit. This gets worse when your software isn’t configured to track CAC and LTV. You keep spending on Google Ads because you always have. Similarly, the health fair booth gets booked because it feels right, not because the numbers say so. Regular clinic software usability testing ensures that marketing and analytics tools are actually being used effectively by staff, helping clinics make more accurate CAC-to-LTV decisions.
However, your clinic software analytics can provide the exact cost and revenue generated by each new patient based on their treatment lifetime. Comparing CAC to LTV per channel might be disturbing. Spending $180 to acquire a patient worth $220 looks fine until you compare it to a referral patient who only costs $40.
The solution here is straightforward. Cut the weak channels. Then put that budget into retention: patient recall, chronic care follow-up, and referral incentives from your best patients.
The Operational Decision: Pull budget from acquisition channels near breakeven. Put it into retention campaigns that target your highest-lifetime-value patients.
Good marketing attracts the right patients. But without room and facility capacity to match, even the right patients can’t generate revenue. Refer to Report 5 for more details.
Report 5: Audit Clinic Software Analytics Reports For Workflow Performance
The Metric Your Report Should Surface: Room turnover speed, plus the percentage of time your diagnostic equipment sits idle.
Most managers skip this report. That’s a costly mistake. It holds the fastest cost-recovery wins in the whole audit. Your clinic runs on a fixed number of rooms and equipment. A vacant room costs you money you can never recover.
Room velocity tracks how fast rooms cycle through patients. Downtime percentage tracks how much equipment time gets lost during operating hours. AHRQ runs the Healthcare Cost and Utilization Project. It tracks ambulatory surgery encounters and outpatient cost patterns across U.S. facilities. It confirms wide variation in how clinics use physical capacity. No standard benchmark exists. However, clinics that track their own throughput hold a clear edge over those that do not.
Does your report flag low-velocity rooms or idle equipment? Take two actions. Firstly, adjust the booking schedule to allow for pre-planned turnarounds. Secondly, lease idle equipment to partner practitioners during slow periods. This helps offset your overhead.
The Operational Decision: Adjust your room booking schedule to build in planned turnaround time. Lease idle equipment to partner practitioners during low-volume periods.
Learn more: Multi-Location Clinic Software: 5 Operations That Break Without Centralized Control explores how operational failures emerge when clinics scale without unified scheduling, patient records, and billing systems.
Final Verdict: The Reports Are Already There. The Decision Is Yours.
In fact, all five signals already exist in your healthcare analytics software. No consultant is needed. No developer is required to unlock them. They are already in your system, just unused. The Clinic Revenue Signal Audit is simple: five reports, five metrics, and five decisions.
Run them weekly and act on them consistently. No-show rates show you where to set deposit rules. AR aging shows you where to improve your front-desk process. CAC vs. LTV shows you which channel to cut. Room velocity shows you which assets to put back to work.
Clinic software analytics only work when someone looks at the right numbers and acts on them. You already have all five. The next move is yours.