Most “benefits of LIMS” articles list things like “improved efficiency” with no numbers attached. That’s not useful when you’re trying to justify a ₹15L+ investment to partners or a board that wants a return they can point to. The real advantages of LIMS show up as measurable changes within 12 months: a 35-45% drop in turnaround time by month 9, a 40-60% cut in error rates, and a 12-18% rise in doctor retention, based on data from Forrester TEI and CAP Q-Probes. This blog breaks down eight outcomes labs can actually track in Year 1, along with how to measure each one against your own lab’s baseline before and after adoption.
- Turnaround time goes down by 35-45% within 9 months
- First-year error rates decrease by 40-60% in Year 1
- When mistakes are reduced, doctor retention goes up by 12-18%
- Preparing for NABL audits gets faster using the built-in trails
- Income per test increases as the number of retests is reduced
- Use the calculator below to see these numbers for your own lab
Why Generic “Benefits of LIMS” Articles Fail Lab Owners
Most vendor content talks about LIMS benefits in vague terms. “Better efficiency.” “Improved patient care.” These phrases sound nice, but they don’t help a lab owner build a board presentation, especially when it’s about a real laboratory information management system investment, not just a buzzword.
Boards do not simply approve budgets based on descriptions. They make their decisions based on the numbers that are tied to a schedule.
The reason is very simple. The majority of LIMS content has been made for potential buyers who have not yet decided. It doesn’t really support owners who need evidence post-purchase. LIMS has significance only when it is connected to a metric, a method, and a period of time. Year 1 is when that evidence shows up.
The following eight points are not mere speculation but are quantifiable first-year results. The Forrester’s 2024 Total Economic Impact study and CAP Q-Probes benchmarking data validate these gains. Besides, every point has a typical range for your laboratory’s numbers to be compared with.
The 8 Measurable Advantages of LIMS in Year 1
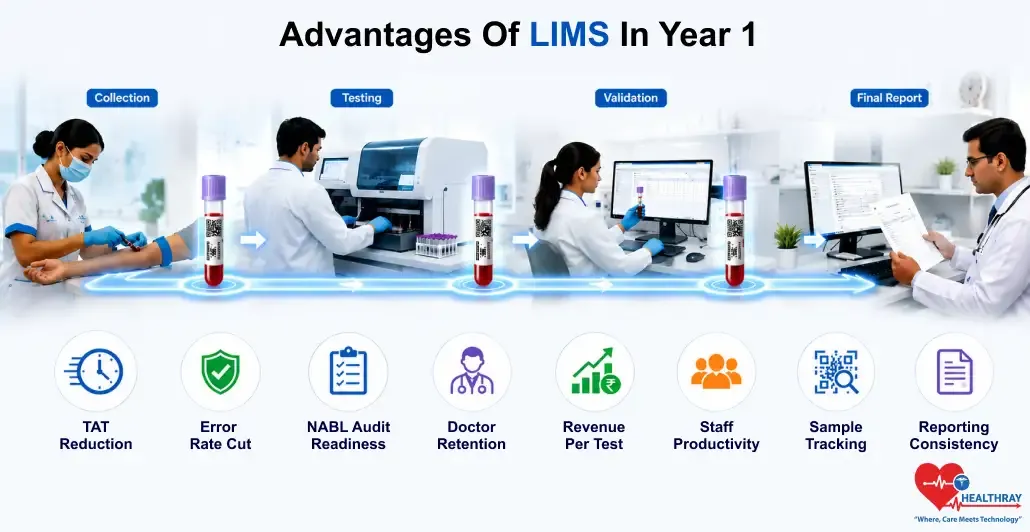
These eight results pair up into four groups. Initially, the first two appear the fastest. Quietly, the last two are the groundwork that enables the other six.
Advantage 1: TAT Reduction
Turnaround time is the easiest LIMS outcome to measure. Most labs already track it in some form. Forrester’s TEI 2024 study found labs see a 35-45% drop in average TAT by month 9, helped by a clear sample workflow that removes the guesswork of where a sample sits at any given moment.
In Practice:
- Automated result routing removes the wait between test completion and report release.
Advantage 2: Error Rate Cut
According to CAP Q-Probes, lab’s error rate drops by 40-60% within a year of LIMS installation. These errors correspond to wrong data entry/information, swapped samples, and errors in reporting.
In Practice:
- Validation rules hold a result back the moment it doesn’t match the patient’s history.
Advantage 3: NABL Audit Readiness
A LIMS with an integrated audit trail can A lot speed up NABL audit preparation. It even reduces the anxiety level of the lab managers who are responsible for it. The audit process can be applied to a radiology workflow that is linked to the system, as records of scans require the same level of traceability as lab samples.
In Practice:
- A lab manager can pull months of audit records in minutes, not days.
Advantage 4: Doctor Retention
Doctor retention rises by 12-18% in the very first year. Actually, doctors will be less inclined to commit errors if they observe that errors are being reported less frequently. Validation and doctor trust are so strongly linked that it shows up even in the retention figures a year later.
In Practice:
- Fewer disputed reports mean fewer doctors quietly start using a different lab.
Would You Like To Find Out First Year Results For Your Lab Size?
A quick 20-minute demo with personalized projections per your testing volume. We will compare your turnaround time, error rate, and revenue per test with your current data. You will get a one-page outcomes projection to share with your board or partners.
Advantage 5: Revenue per Test
A reduced number of repeat tests and a lower rate of disputed results lead to an increase in revenue per test. A test that is free of re-runs generates income instead of incurring expenses.
In Practice:
- A CBC that doesn’t get repeated frees up that slot for a new patient.
Advantage 6: Staff Productivity
Manual data entry and report formatting require less staff time when a LIMS automates these processes. The time saved is used for actual lab work.
In Practice:
- The same staff process more samples per shift without any extra hires.
Advantage 7: Sample Tracking
A LIMS tracks every sample from collection to final report, across machines like the Sysmex XN-1000, Mindray BC-6800, or Beckman analyzers. Many labs tag samples with a QR code at collection and use a QR code scanner at each handoff point, so a tube’s location is logged the moment it moves instead of relying on a handwritten label.
In Practice:
- A sample never sits in an unknown location, since every step gets logged live.
This isn’t just a theoretical gain. Jeevan Rekha Hospital in Raigarh, West Bengal, saw a sample processing speed jump 80% after moving from manual tracking to a connected LIMS, with the same lab team handling a growing patient load.
| “Manual tracking slowed our lab. Healthray LIMS scaled diagnostics as sample volumes grew.” – Senior Administrator, Jeevan Rekha Hospital |
Advantage 8: Reporting Consistency
Reports made with a LIMS are consistent in format and reference ranges. This is mainly important for labs that handle large volumes of tests.
In Practice:
- A urine routine or lipid profile report looks identical, no matter which technician ran it.
Learn more: Wondering how to pick the right LIMS for your lab’s actual needs? 12 Questions to Choose LIMS Without Buyer Regret covers what to check before signing a contract.
How to Measure Each Outcome in Your Lab
The first step in measuring these eight outcomes is to establish a baseline before LIMS goes live. Then keep track continuously after. A lot of labs, unfortunately, omit the baseline step and, as a result, fail to demonstrate improvements later, even if they actually occur.
Use the calculator below to project your own Year-1 numbers. Enter your current TAT, error rate, and daily test volume, and see exactly where your lab should land, whether you run 50 tests a day or 500.
See where your lab could land in 12 months
Enter your lab’s current numbers. The projection ranges below use the same Forrester TEI and CAP Q-Probes benchmarks cited throughout this article, not a vendor’s best-case figures.
Fewer flagged errors
—
per month
Revenue protected
—
per month, from avoided retests
Annual revenue protected
—
estimated, Year 1
Ranges reflect typical Year-1 outcomes: a 35–45% TAT reduction by month 9 and a 40–60% error rate reduction in Year 1 (Forrester TEI 2024; CAP Q-Probes). Revenue protected assumes avoided errors would otherwise require a re-run at your stated revenue per test. Actual results vary by lab size, test mix, and how consistently the system is used.
Get a custom outcomes report for your lab →The ranges in the calculator are derived from the same sources that we have cited all along in this piece, Forrester’s TEI study and CAP Q-Probes benchmarking, not a vendor’s most optimistic figures. Increase your figures now, then revisit at month 6 and month 12 to compare how close you were to the forecast.
The Bottom Line
The eight benefits of LIMS described here only make sense when you compare them to the performance of your own lab rather than the vendor’s average. If a laboratory monitors turnaround time (TAT), error rate, and retention from the very first day, at the end of the 12th month, it will have evidence rather than speculation. This evidence is what changes a 15L+ capital expenditure into a decision that your board doesn’t have to take on faith.