Summary
Radiology analytics dashboard bridges the gap between images and data. It converts raw radiology information such as scan volumes, reporting time, workload distribution and machine usage into clear and actionable insights. In the traditional system, radiologists depended on manual reports and unreal decisions that didn’t give high-impact outputs.
With radiology analytics dashboards, radiologists can better understand their work, administrators can improve their efficiency and leaders can make highly data-driven tangible decisions. Beyond images, RIS helps radiology to transform old approaches and adopt dependable practices. These proactive and future-ready strategies build a system where decision performance, quality and patient care become more efficient and strong. In this blog I will discuss how a radiologist analytics dashboard can provide profitable insights and help you analyze the reports more deeply. Keep reading!!!
Introduction
Radiology is, as always, an image-driven field. Gray-scale patterns reflecting on the screen demonstrate subtle details. But in today’s predictive medical context, simply capturing images is not sufficient. Every scan carries valuable data. Reporting delays, workload pressure, machine utilization, and patient outcomes that still remain invisible. The radiology analytics dashboard provides you a platform where all data is compiled into compelling insights. These raw data help radiologists present reports in clear and decisive insights.
Radiologists can view imaging volumes, turnaround time, radiologist productivity, and modality performance that are presented in a single screen in real time. Previously, the work was accomplished with spreadsheets or manual analysis; now, with the mobile RIS applications dashboards, it takes a few minutes to prepare reports and analyze them deeply. Administrators get clear visibility on operation. Radiologists can manage their workloads more efficiently. Decision-makers now formulate conclusions on the basis of data; they no longer make hypothetical decisions. From images to insights, this journey encourages radiologists to think strategically. Analytics dashboards do not just display numbers; they display the entire performance journey and set the right direction for future growth.
Radiology Analytics Dashboard Evolution: The Changing Face of Radiology Analytics
The Beginning: Basic PACS-Integrated Alerts
The evaluation of Radiology dashboards begins with simple PACS-based alerts. Furthermore, its main focus is on highlighting unsigned reports or pending queues so that radiologists can take timely actions.
Improving Turnaround Time
Visual indicators and direct report-signing links have significantly reduced reporting delays. Moreover, through early systems, there were 24% improvements in turnaround time.
From Alerts to Analytics
As the radiology volumes increase, dashboards evolve along with that. Beyond alerts, the system can track analytics and performance.
Real-Time Trending Insights
Modern dashboards display real-time data trends such as study volumes, reporting delays, and peak workload hours. Further, these insights make the planning more accurate.
Multi-Site Performance Optimization
For large hospital networks, a radiology information system is a defining moment. Further, dashboards compare different center performance and identify bottlenecks.
AI-Driven Reject Analysis
Clinics can easily perform image reject analysis after integrating AI. Furthermore, technicians can easily understand the reason behind the image rejection. Thus, it reduces repeat scans and patient exposure.
Role-Based Dashboard Customization
Nowadays, dashboards are highly customizable. Furthermore, radiologists can easily view pending cases. Additionally, technicians can check quality metrics and managers can track overall KPI trends.
Seamless EHR Integration
Ehr integration makes the data flow smooth. Furthermore, it upholds HIPAA conformity. Thus, meaningful use standards naturally flow.
From Monitoring to Decision-Making
Modern radiology dashboards are not merely a monitoring tool. Further, it has become a strategic decision-making platform that makes the platform agile for the future.
Core Features of Radiology Analytics Dashboards
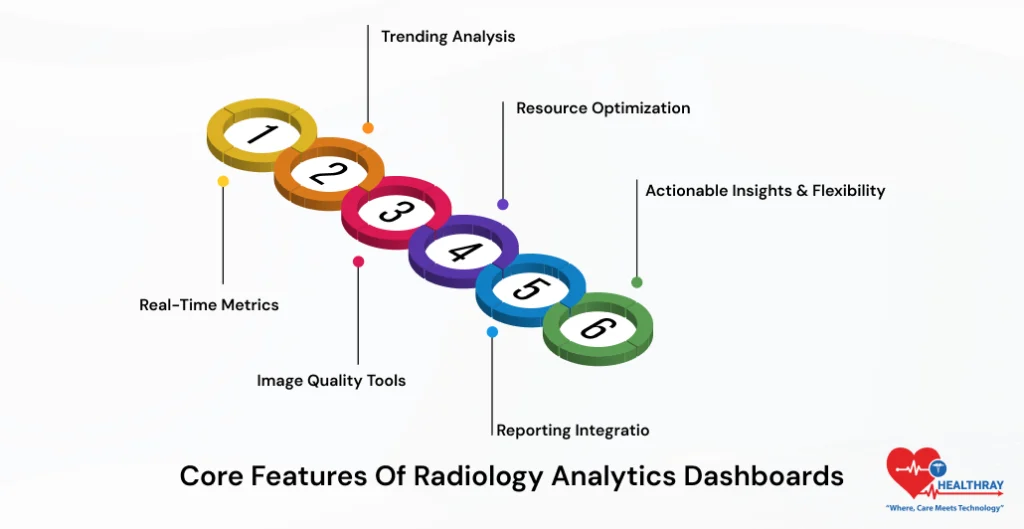
Radiology delivers its real power through intuitive interfaces and data-driven features that make the daily operation simple and measurable. Let’s check out some interesting features of radiology analytics dashboards:
Real-Time Metrics
With live updates, radiologists can track exam volumes, turnaround times, cancellation rates and waiting room delays. Thus, it helps team members to instantly identify any uncertainties and take concrete steps to resolve them.
Trending Analysis
RIS dashboards encompass features like hourly scheduler activity and seven-day multi-site performance. Furthermore, this helps radiologists deeply evaluate workflow patterns. Also, it highlights inefficiencies clearly. Also, read our blog RIS trends to know more about current trends.
Image Quality Tools
Visual views of reject rates, exposure levels and rejected images help technicians minimize repeat scans and improve image quality.
Resource Optimization
Dashboards monitor modality volumes, charges, reimbursements and accounts receivable against targets. Thus, it helps clinics properly control their financial resources.
Reporting Integration
RIS dashboards embed speech recognition, structured reporting and AI-assisted dictation; this makes the reports fast and highly efficient.
Actionable Insights & Flexibility
Drill-down views, role-based customization and easy export options allow radiologists to make proactive decisions. Further, they no longer just constrain themselves to monitoring.
The Data Pipeline Journey: From Capture to Clarity
Image Acquisition: The Starting Point
The radiology workflow commences with capturing modality. Furthermore, it generates images with CT, MRI, and X-ray and directly feeds them into PACS archives.
From Pixels to Data
Dashboards not only recognize images but they also extract metadata from them. Further, they convert slice thickness, contrast usage, acquisition time and unstructured pixels into queryable datasets.
Metadata Intelligence
This metadata becomes a foundation of understanding reporting quality, protocol adherence and workflow efficiency. Furthermore, this was impossible for traditional image viewers.
Standards-Driven Integration
Radiology software uses ingestion layer HL7 and FHIR standards. Furthermore, this makes the RIS integration seamless. Also, it accurately maintains the chronological timeline for every case.
AI-Powered Preprocessing
Modern dashboards apply AI and computer vision algorithms. Furthermore, AI-powered radiology software analyzes images at pre-read stages.
Artifact & Anomaly Detection
Edge detection models identify motion artifacts. Furthermore, RIS software flags poor-quality scans at an early stage.
Dose Monitoring & ALARA Compliance
Dose estimation models benchmark radiation exposure. Furthermore, it determines whether or not the ALARA principles are properly applied in the systems.
Normalized, Analytics-Ready Data
All AI outputs are converted to normalized datasets. Furthermore, they can conduct multiple studies using aggregation and advanced analytics. Overall, the data pipeline transforms radiology dashboards into both visual tools and intelligence engines.
Clinical Impact Across Specialties
High-Volume Environments: Where Speed Matters
In high-pressure departments such as ER and Orthopedics, dashboards make the workflows fast and accurate. Also, it eliminates the need to compromise on clinical qualities.
ER Dashboards: Smart Triage in Action
ER dashboards use NLP to detect critical keywords from orders, such as “stat.” Also, radiology analytics dashboards route the fracture cases automatically to dedicated readers.
Faster Decisions, Better Outcomes
This intelligent triage minimizes the reporting delays. Furthermore, radiologists can quickly make clinical decisions. Also, it minimizes patient waiting time drastically.
Orthopedics: Imaging Meets Implants
Ortho-specific dashboards overlap implant registries with imaging data. Thus, it simplifies post-surgical monitoring and long-term tracking. The role of RIS in hospitals is enormous; all it needs is the right strategies to unleash its full potential.
Tracking Revisions with Evidence
A radiologist can easily track revision rates against imaging findings. Furthermore, it assists clinics in recognizing patterns, surgical performance issues, and outcome trends.
Oncology: Measuring What Matters
Oncology dashboards plot RECIST measurements on serial CT scans. Furthermore, this allows radiologists to easily visualize or quantify tumor response.
PET Integration for Deeper Insight
PET SUV trends can easily understand integration; it’s not just size, but also metabolic response. Furthermore, this is a strong indicator of treatment effectiveness.
Neurology: Precision in Stroke Care
Neuro dashboards segment stroke volume and correlate ASPECTS scores with clinical outcomes.
Protocol Refinement Through Data
This correlation refines stroke protocols. Thus, it makes the decision-making completely based on evidence and also optimizes patient recovery pathways. Overall, clinical dashboards create unique value for every specialty. Whether it’s about volume or complexity, in both scenarios it delivers clarity and confidence.
Step towards digital era with our healthcare solution
Revamp your hospital facilities and embrace change for better healthcare management. Ease in managing and organizing large medical datasets leads to effective analysis. Seize the opportunity now!
Integration Ecosystem: Connecting the Radiology Universe
Beyond RIS & PACS
Modern radiology dashboards are not just limited to RIS and PACS. Furthermore, they have become a part of a broader integration ecosystem.
EHR Integration for Clinical Context
Through FHIR APIs, ehr vitals are directly pulled from dashboards, for example, understanding creatinine levels before contrast studies. Therefore, it makes the clinical decisions faster and safer.
Context-Rich Case Views
Radiologists get a clear picture of patient vitals, lab values and imaging data in a single dashboard. Thus, Ris evades the need to switch systems, and doctors get clear visibility on all symptoms.
Billing & Revenue Cycle Synergy
Billing integrations automatically populate RVUs from structured reports. Hence, it minimizes manual abstraction and revenue leakage.
Longitudinal Imaging Views
Radiology management software dashboards normalize prior studies of different systems. Thus, it simplifies longitudinal comparisons and disease progression tracking.
Tele-Radiology Enablement
Global worklists can synchronize with nighthawk and remote queries. Thus, it helps remote patients to consult even during midnight without the need to travel miles for doctor check-ups.
Vendor-Neutral Archives (VNA)
VNA allows radiologists to search and analyze old data stored in different systems. Further, radiologists can compare all the records in a single dashboard. They no longer need to open multiple tabs to fetch a single piece of information. Also, they can access records from anywhere even if vendors are different.
Time-Zone Performance Visibility
Dashboards flag turnaround time disparities across time zones. Further, it helps leaders balance workloads and maintain service-level commitments. Overall, the integration ecosystem makes radiologist dashboards a truly connected intelligence platform.
Conclusion
Radiology analytics dashboards create a connection between imaging breakthroughs and operational superiority. It converts data streams into clear, concrete intelligence. Its real-time workflow nudges drastically reduce turnaround time and AI-driven quality checks minimize repeat scans. It breaks down alignment siloed working and expedites the decision-making.